
How to Find Trading Patterns in Your Journal
- HybridTrader Editorial
- Updated

Traders often wonder whether reviewing past trades can reveal genuine patterns in their decision-making, and whether those patterns matter. The answer depends on what is being recorded and how it's analyzed. A systematic trade journal can capture entry reasons, emotional states, plan adherence, and market context; these records then become evidence for identifying recurring sequences of decisions or behaviors. The journal can show that a pattern appeared in recorded trades; it cannot establish with certaincertainty why it occurred. A repeated association is evidence worth reviewing, not proof of causation. The practical task is to distinguish a genuine behavioral tendency from a one-time event, and to separate what the data shows from what it cannot explain.
This guide walks through how to organize trade records for pattern detection, what kinds of evidence a journal can hold, and how to frame questions about repeated occurrences without confusing correlation with cause.
Quick answer: Recognizing repeated behavior in trade records
Repeated patterns emerge when a trader records not only trade results but also the reasoning, emotional state, and plan adherence surrounding each decision. A pattern is a recurring sequence, not a single trade or isolated event.
For instance, a trader might observe that after three consecutive winning trades, the next entry was made without the usual technical confirmation, and the position was sized larger than planned. If this sequence recurs across multiple sessions, it qualifies as a behavioral pattern worth investigating.
The data recorded in a journal can demonstrate that a pattern exists and how often it appears. What it cannot do is prove that one factor caused another. A journal entry noting frustration before a trade and a subsequent loss shows association; it does not prove that frustration caused the loss, or that the loss was avoidable had the trader felt differently.
What the behaviour may look like
Behavioral patterns in trading take many forms. Identifying them requires looking beyond profit and loss alone.
Common recurring patterns include:
- Abandoning a strategy after a small number of losses, even when the strategy had a defined risk tolerance and the losses fell within plan.
- Chasing trades after seeing a profitable move, entering positions without the usual analysis, then closing them quickly at a small loss or modest gain.
- Increasing position size after a winning streak, deviating from the planned risk per trade.
- Placing stop-losses too tight following a series of small wins, resulting in frequent stop-outs on minor retracements.
- Trading during specific times of day when fatigued or distracted, with a higher rate of plan deviations compared to other sessions.
- Holding losing positions longer than planned, rationalizing the wait or awaiting a reversal rather than honoring the exit signal.
Each reflects a recurrence in the process of decision-making. A pattern implies that the same type of decision or behavior has appeared at least several times across different trades or sessions, not just once.
What evidence a journal can record
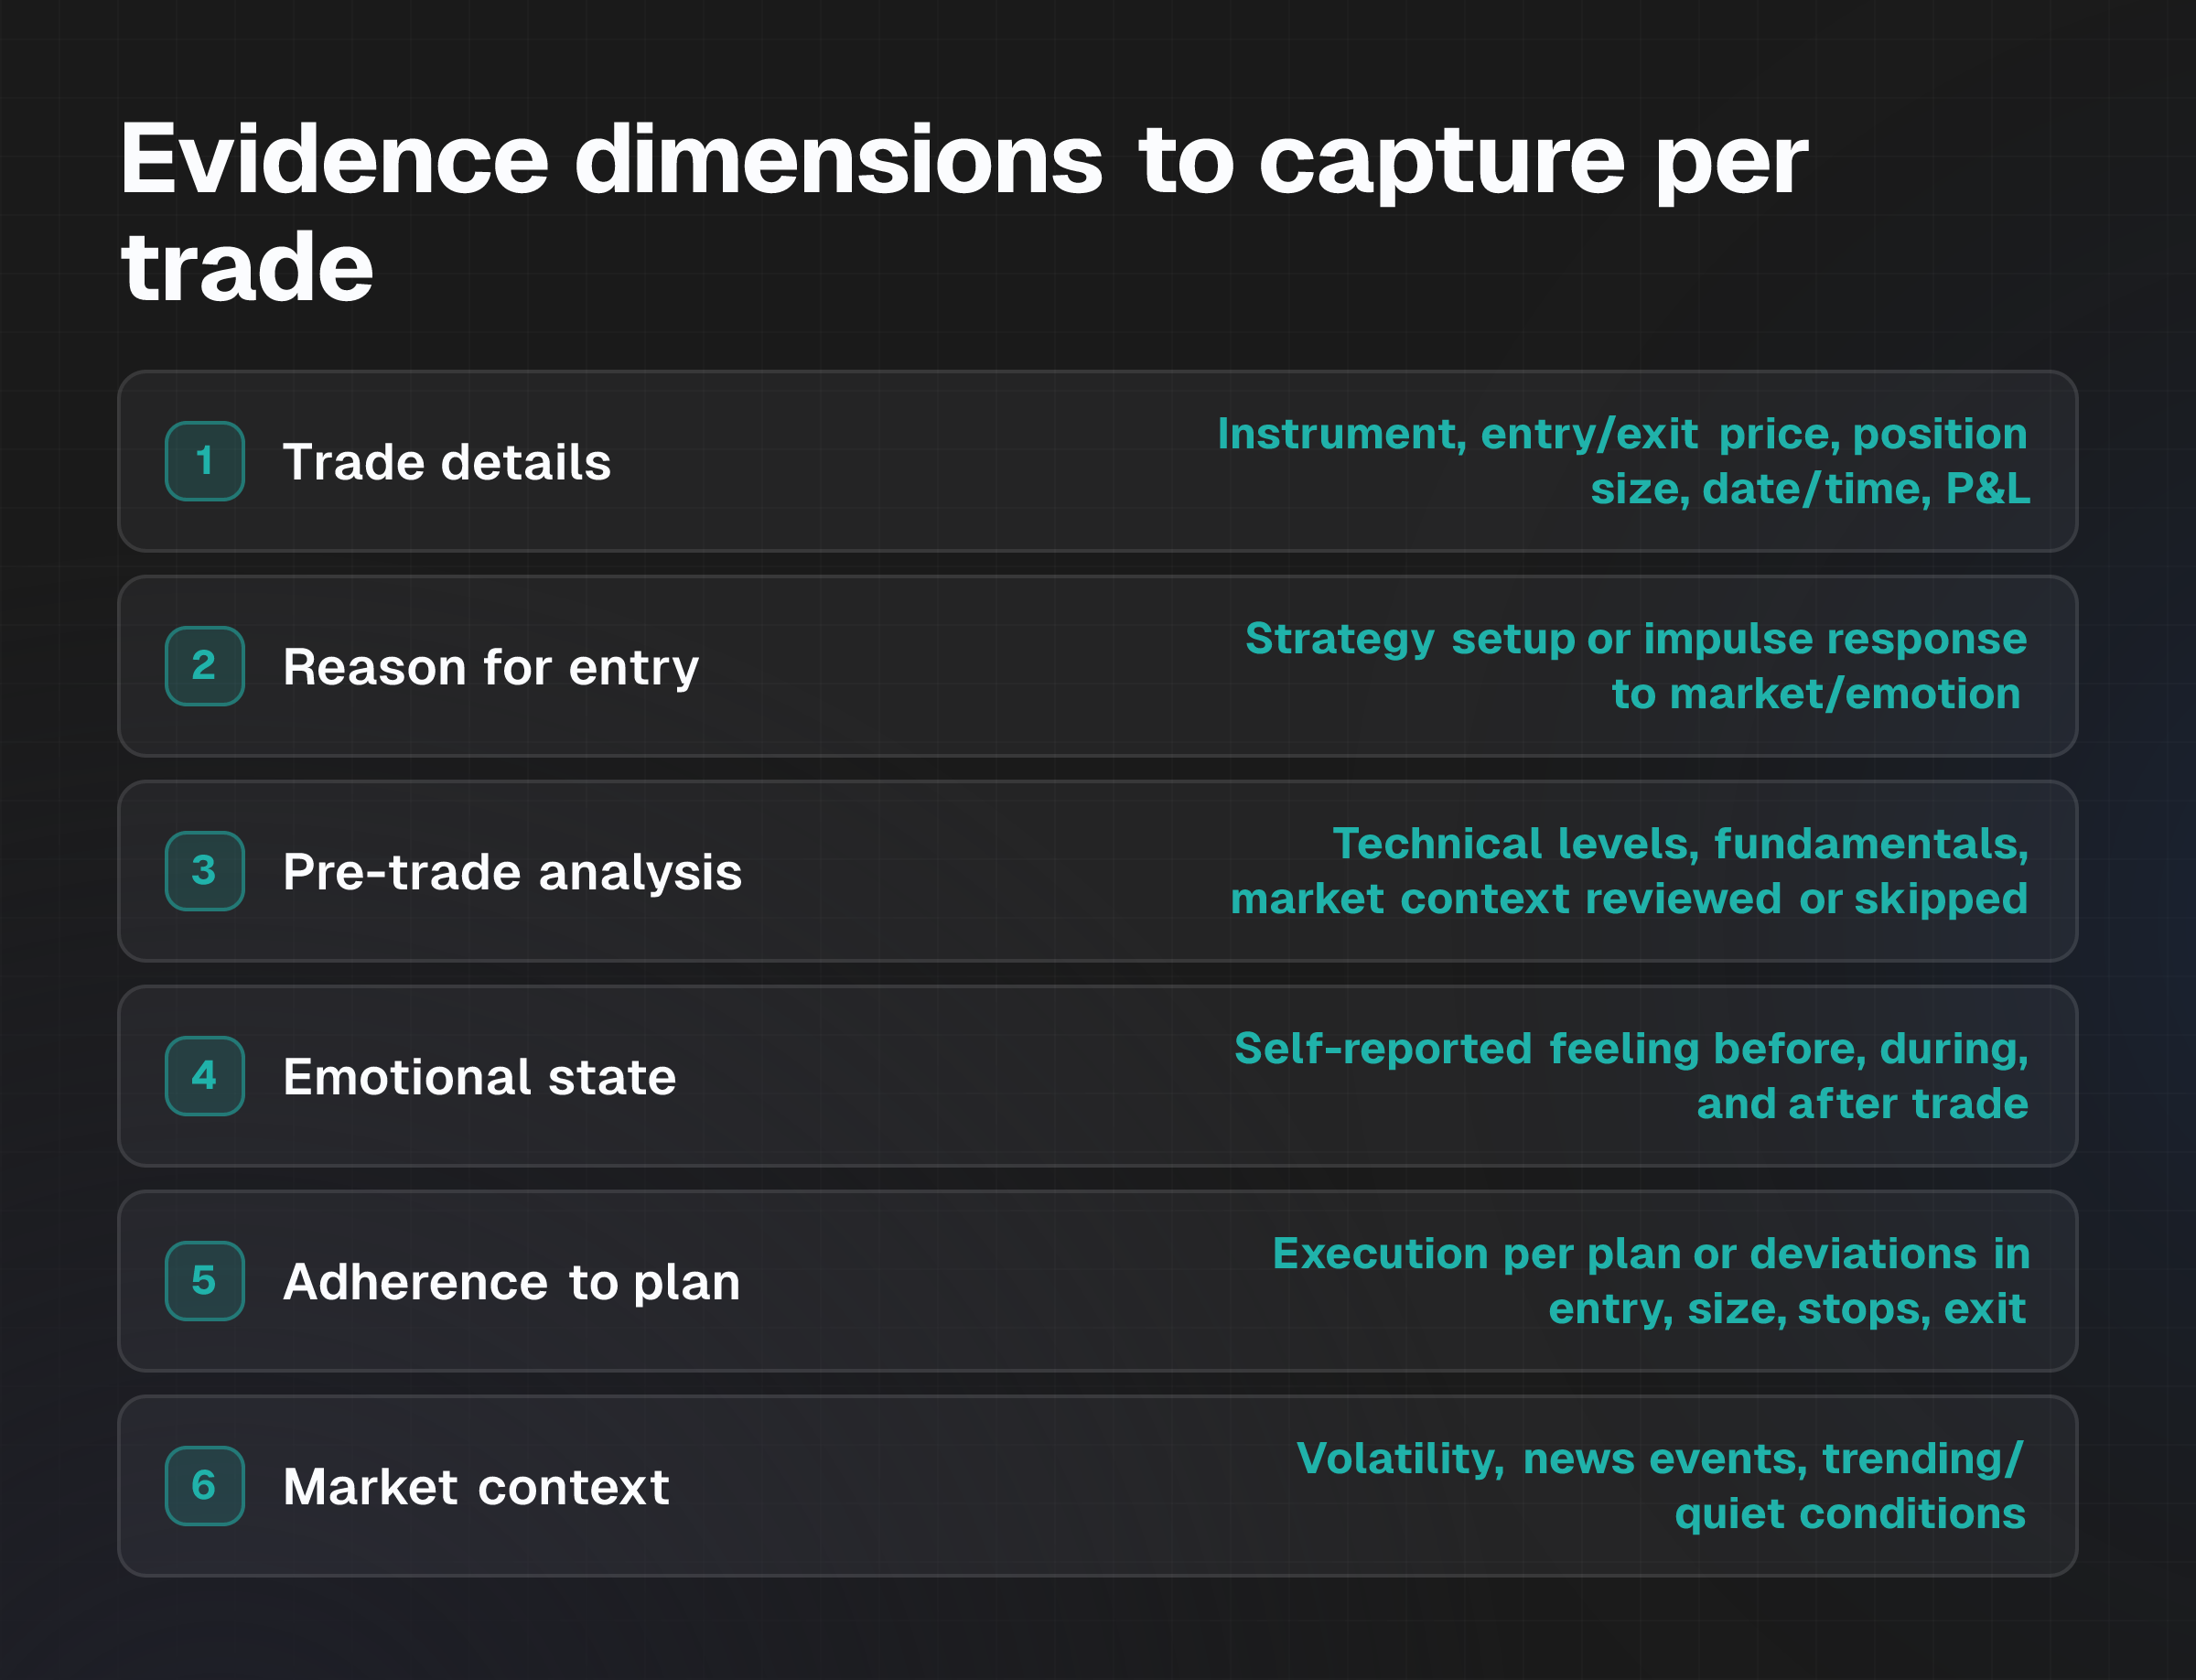
A complete trade journal captures data across several dimensions. The foundation includes basic trade details: instrument, entry and exit price, position size, date and time, and profit or loss. Beyond these, a journal can record the conditions and reasoning that preceded and followed the trade.
Reason for entry
Was the trade initiated because a predefined strategy setup appeared, or was it an impulse response to market movement, news, or emotional reaction? Recording the stated reason at the time of entry creates a baseline against which later reflection can be checked.
Pre-trade analysis
What analysis or market scanning was performed before entry? Did the trader review technical levels, check fundamental catalysts, assess broader market context? Or skip this step entirely?
Emotional state
How did the trader describe their feeling before the trade, confident, anxious, frustrated, excited, during it, and after the exit? Emotional self-reporting is subjective but provides honest data about the trader's internal state at the time of decision.
Adherence to plan
Was the trade executed according to a predefined plan, or did it deviate? Common deviations include entry price, position size, stop-loss placement, or exit rules.
Market context
What was happening in the broader market at the time? Was there significant volatility, a news event, a trending session, or quiet conditions? Recording context helps distinguish between trades made in similar market environments and those made in different ones.
Exit reasoning
Was the position closed because the exit signal appeared, or because of emotional discomfort, profit-taking impulse, or an external distraction?
Methods of recording range from manual notebooks or spreadsheets to digital trading journals. Some platforms support integration with brokers, allowing automatic import of trade fills and data, which reduces manual entry errors. Others rely on CSV import or manual data entry. Consistency in recording matters more than the tool chosen; gaps or selective logging can distort later pattern analysis.
What the data cannot explain
A journal entry documenting that a trader felt frustrated before a trade and then took a loss records an association, two events appearing together in time. It does not explain causation.
Frustration may have influenced the decision, but it may also have been incidental; the loss may have resulted from poor price action, inadequate analysis, or bad luck rather than emotional state. Research in behavioral finance, including work by Odean (1998) and Barber & Odean (2000, 2001), identified patterns such as overconfidence leading to excessive trading, but even these studies document correlations across populations, not the specific causal mechanism in any individual trader's account.
Several limits apply to what a journal can establish:
- Single trades aren't patterns. One trade made in frustration that resulted in a loss is data, not evidence of a repeated behavior.
- Missing context distorts analysis. If a trader records emotional state but not market conditions, or logs plan adherence but not the reasoning behind entries, the pattern detected may be incomplete or misleading.
- Selective memory affects qualitative entries. A trader may remember and record emotional states after losing trades more vividly than after winning ones, creating a false impression of frequency.
- Profit and loss alone don't reveal decision quality. A winning trade can follow a poor decision (good luck), while a losing trade can follow a sound process (bad luck). Analyzing only outcomes, not processes, obscures the actual behavioral patterns at work.
- Market context changes. A pattern observed during a trending market may not recur during range-bound conditions, or vice versa. Without recording market environment, this distinction is lost.
The journal can show that a pattern appeared; it cannot establish with certainty why it occurred or whether it'll recur under different market conditions.
How to review repeated occurrences
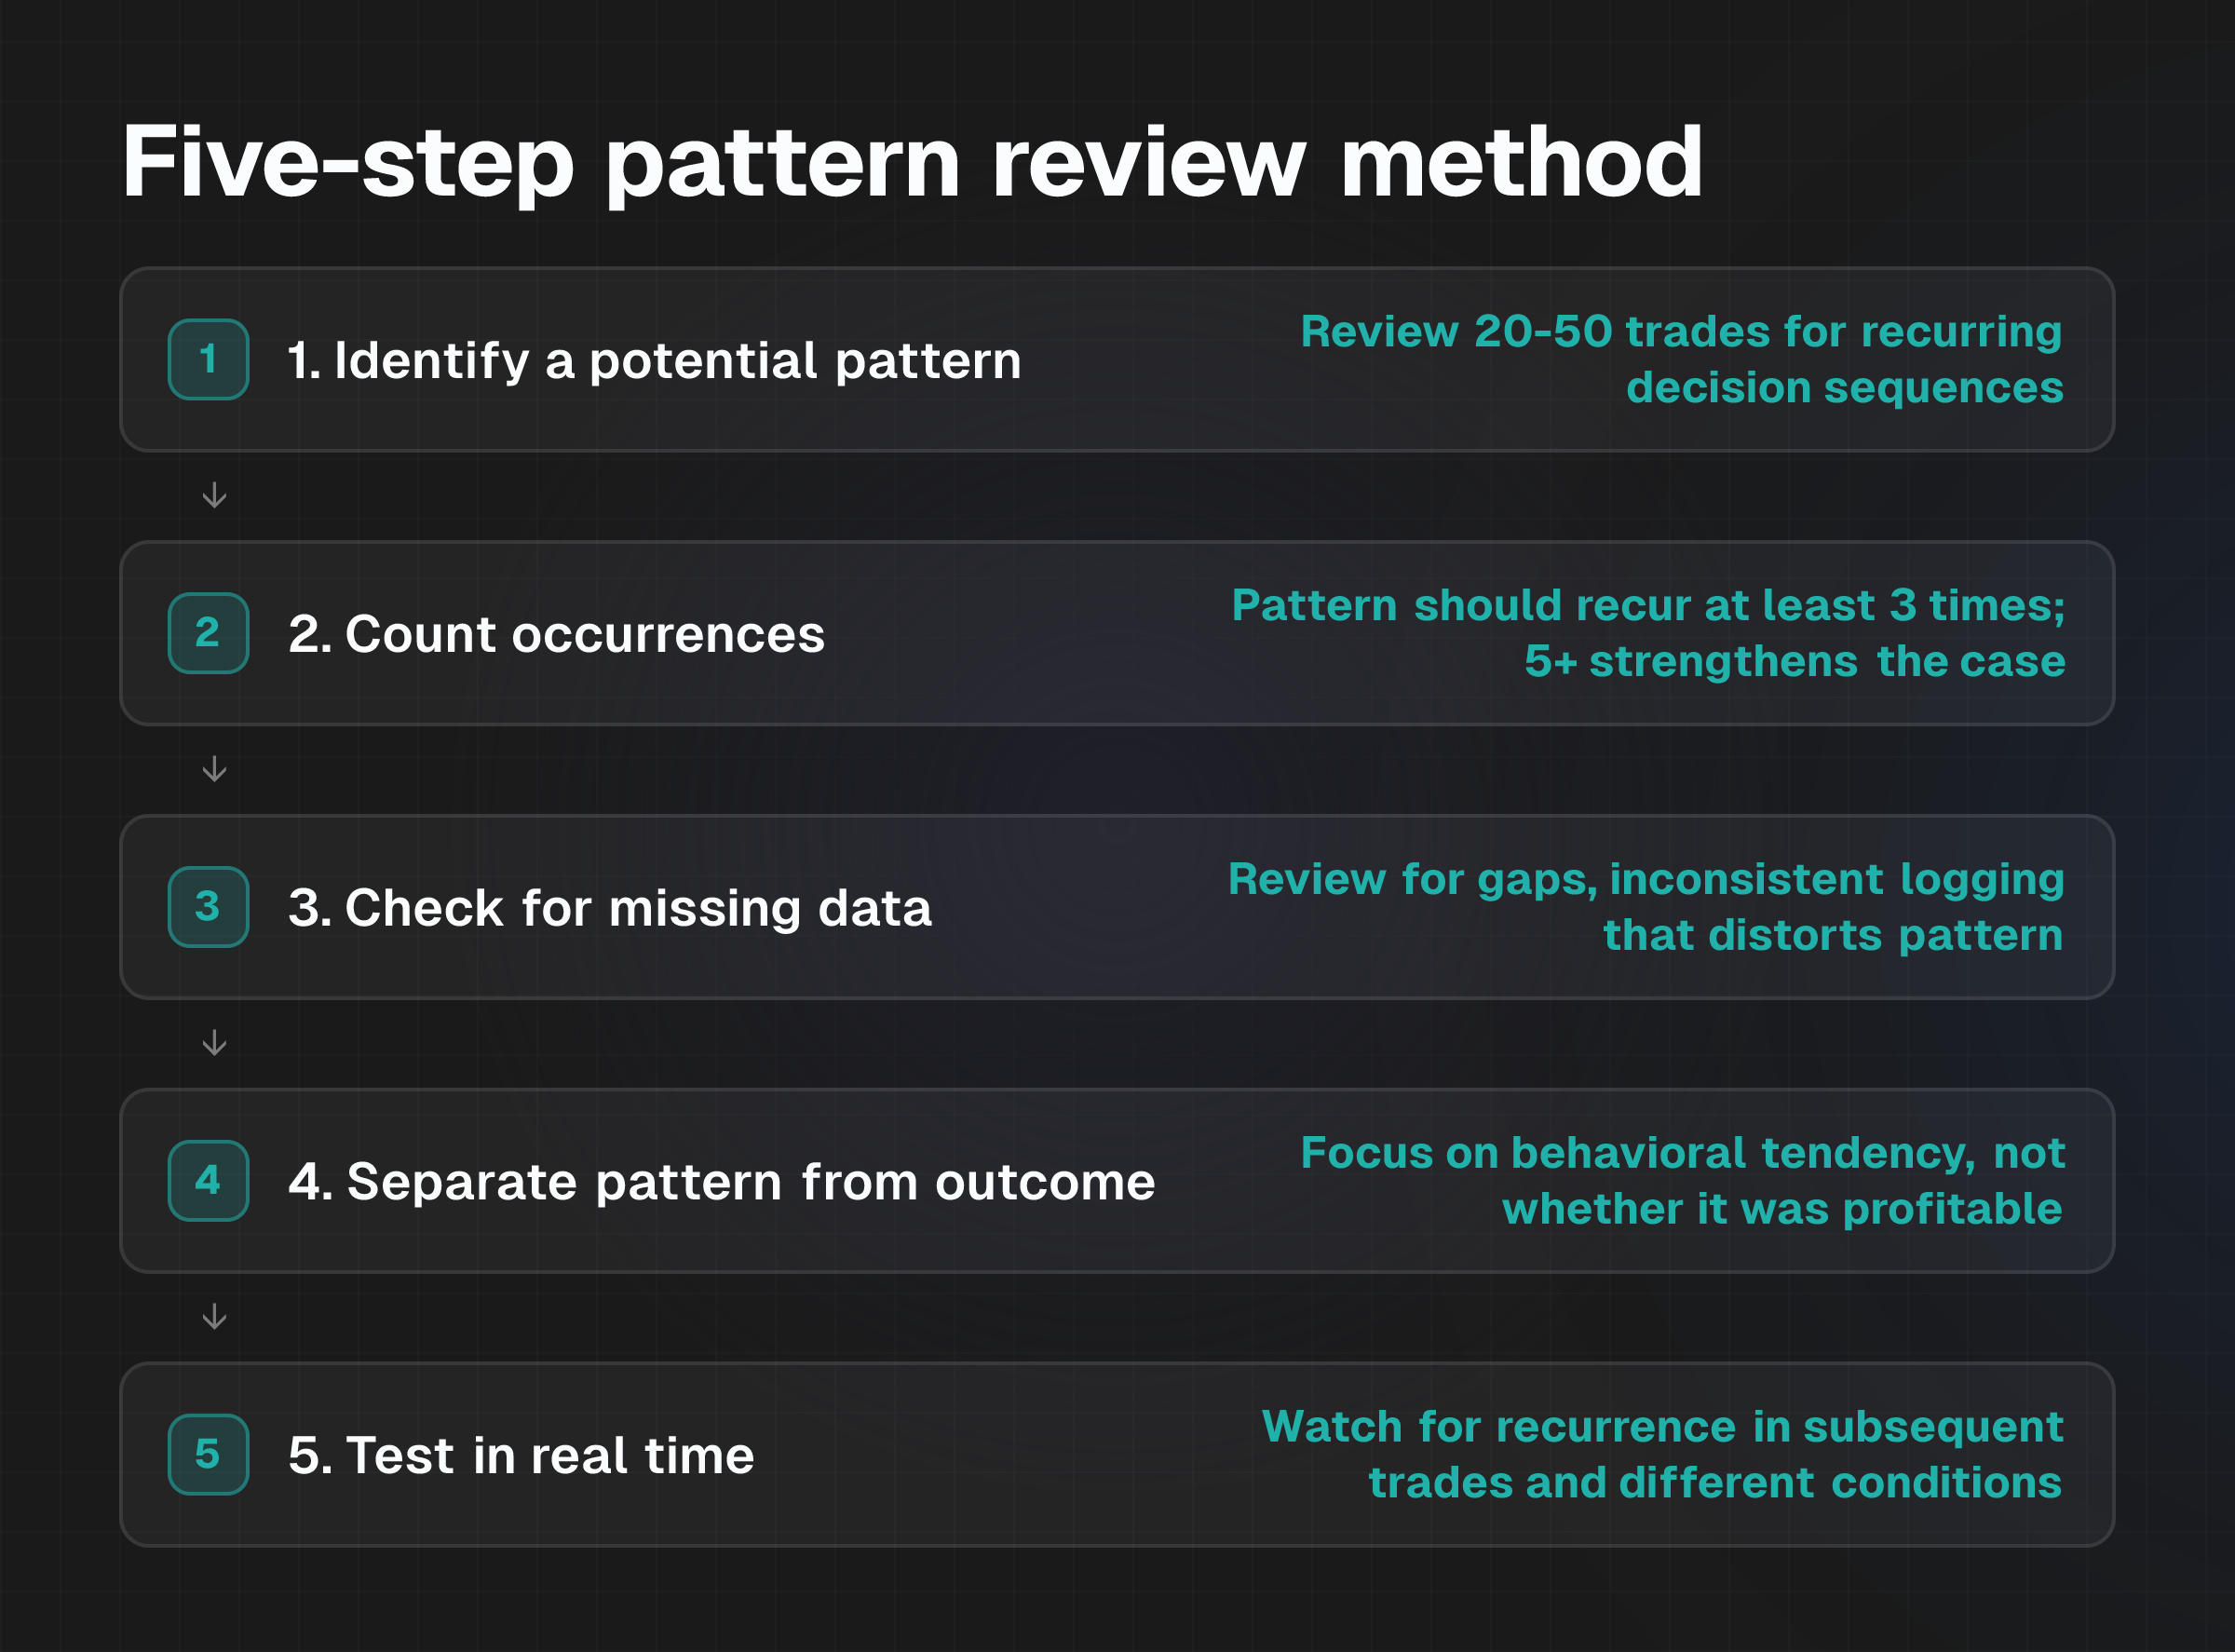
Distinguishing a genuine repeated pattern from coincidence or confirmation bias requires a structured approach to reviewing the data.
Step 1: Identify a potential pattern
Review journal entries across a defined period, typically 20 to 50 trades, depending on trading frequency. Look for a sequence of decisions, emotions, or deviations that repeats. For example: "After a winning trade, the next entry was made without the usual technical confirmation" or "Trades made between 9:00 and 10:00 a.m. have a higher deviation rate from plan than afternoon trades."
Step 2: Count occurrences
Count how many times the potential pattern appeared in the review period. A pattern should recur at least three times to warrant serious investigation; five or more occurrences across different sessions or market conditions strengthens the case.
Step 3: Check for missing data
Review the entries for that period. Are there gaps in the journal? Were emotional states recorded for some trades but not others? Did the trader stop logging plan adherence after a certain date? Missing or inconsistent records can create the false appearance of a pattern or hide one that's actually present.
Step 4: Separate the pattern from the outcome
A pattern is a behavioral tendency, not a trading result. A trader might repeatedly make entries without technical confirmation after a win, and these entries might be profitable despite the poor process, or unprofitable despite luck. The pattern, the deviation from process, is the focus, not whether it made or lost money in those specific cases.
Step 5: Test the hypothesis in real time
Once a potential pattern is identified, the trader can watch for it in subsequent trades. Did the pattern recur as predicted? Did it appear in different market conditions, or only in specific environments? Real-time observation helps confirm whether the pattern is genuine or a statistical artifact of the review period.
Questions to ask after the trade
Structured reflection questions help traders move from vague impressions to recorded data and testable observations. These questions are best answered in the journal entry at or shortly after trade exit.
- Was this trade initiated according to a predefined strategy setup, or was it a response to something else? The something else could be market movement, news, another trader's call, or internal restlessness. Recording the honest answer reveals whether plan adherence is consistent.
- What analysis was performed before entry? Did the trader review chart patterns, fundamental catalysts, or broader market context? Or was the entry made with minimal pre-trade work?
- What was the emotional state before the entry? Not in hindsight, but in the moment. Was there confidence in the setup, or anxiety, excitement, or frustration driving the decision?
- Did the trade follow the position sizing rules? Was the risk per trade within the planned range, or was the position larger or smaller than usual?
- Where was the stop-loss placed, and why? Was it at a technical level from the original plan, or adjusted based on comfort or fear after entry?
- What was the exit reason? Did the exit signal appear as defined in the strategy, or was the position closed for emotional reasons, profit-taking, or external distraction?
- Looking back, was the reason for entry sound, or was the decision reaction to something else? This reflection, written after the trade closes, captures hindsight that the entry-time journal may not have captured.
These questions don't require perfect answers. Many traders will find their reasoning mixed, part strategy, part emotion, part external pressure. Recording the honest mix is what makes the journal useful for pattern detection.
Practical review checklist
A trader aiming to review trade records systematically can use this checklist to structure a weekly or monthly review session:
Data integrity
- All trades for the period are logged (no selective omission of losses or small trades).
- Entry and exit prices, times, and position sizes are recorded.
- Profit and loss figures are calculated consistently.
- Emotional state and plan adherence are noted for at least 80% of trades.
Pattern identification
- Review the last 20-50 trades and list any sequence of decisions or behaviors that appears more than once.
- For each potential pattern, count how many times it recurred.
- Note whether the pattern appeared across different market conditions or only in specific environments.
- Check whether the pattern correlates with higher losses, lower win rates, or larger drawdowns, or whether it appears regardless of outcome.
Causation vs. correlation
- For each recurring pattern, state what appears to precede it (e.g., "winning streak," "time of day," "low volatility").
- Note that correlation doesn't prove causation; the journal shows association, not cause.
- Identify what the journal cannot explain (e.g., whether fatigue caused poor decisions, or whether the poor decisions would've been made anyway).
Hypothesis formation
- Based on the pattern, form a testable hypothesis (e.g., "After three consecutive winning trades, plan adherence falls by more than 50%").
- Decide on a monitoring period (e.g., the next 10 trades or one week) to observe whether the pattern recurs as predicted.
Adjustment planning
- If a pattern is confirmed, design a specific rule or checklist to mitigate it (e.g., "After a win, mandatory 10-minute break before the next entry" or "Position size capped at 50% of plan allocation after a winning streak").
- Record the adjustment in the pre-trade game plan.
- Log whether the adjustment was followed in subsequent trades and whether it affected the pattern's recurrence.
Limitations
Several important limitations apply to pattern analysis through journaling.
Time and consistency required Systematic journaling demands regular effort, often 10-20 minutes per trade or per session. Traders who don't maintain consistent records over weeks or months will have insufficient data for reliable pattern detection. Sporadic or selective logging creates gaps that distort analysis.
Confirmation bias in interpretation A trader may unconsciously seek out patterns that confirm an existing belief about their trading ("I always overtrade after wins" or "I'm too timid in the morning"). Reviewing the journal with the intent to find evidence of a preexisting hypothesis can lead to misinterpretation of ambiguous data. The hedge is to count occurrences objectively and compare them to the base rate of trades overall.
Emotional self-reporting is subjective A trader's description of their emotional state at the time of a trade is honest data about their internal experience, but it's not clinical measurement. Frustration may be interpreted as mild irritation by one trader and acute anger by another. Consistency in language within a trader's own journal helps, but cross-trader comparison is unreliable.
One-time events masquerade as patterns If a trader identifies a sequence of three trades made in quick succession, all losing, and labels this a pattern of "chase trading," further review may reveal that this sequence appeared only once in a 200-trade sample, making it an isolated event rather than a repeated pattern. The threshold for calling something a pattern should be at least three to five recurrences across different sessions or market conditions, depending on trading frequency.
Process quality and outcome aren't the same A trader may have a repeated pattern of poor decision-making (e.g., entering without analysis) that's sometimes profitable by luck and sometimes not. Analyzing only the profitable subset of these trades would obscure the poor process. Conversely, a trader with a sound process may experience a streak of losses due to adverse market conditions. Neither outcome alone reveals the pattern.
Missing or incomplete records limit scope If a trader records entry reason and outcome but not emotional state or market context, pattern analysis is constrained to those dimensions. The full picture of behavioral decision-making may remain hidden.
Market context changes A pattern observed during a strong uptrend may not recur during range-bound or downtrend conditions. Without consistent recording of market environment, this distinction is invisible, and the trader may over-generalize the pattern's relevance.
Next step
The practical first step is to commit to recording five additional data points for the next 10 to 20 trades: entry reason (strategy setup vs. impulse), emotional state before entry, adherence to plan (yes/no or % deviation), market context (trending, ranging, volatile, quiet), and exit reason. These additions to a basic trade log create the foundation for meaningful pattern analysis.
After 20 trades, review the entries for any recurring sequences. Don't interpret causation yet; simply list what appears to repeat. Then decide whether to monitor the next 10-20 trades specifically for those patterns. This step moves the trader from intuition to evidence-based observation.
Journaling doesn't replace a sound trading strategy, robust risk controls, or personal responsibility for decisions. It's a tool for developing self-awareness about decision patterns. The insights revealed through a journal are most useful when incorporated into a pre-trade checklist or game plan, a deliberate reminder to pause and verify that the trade is being made according to plan, not driven by a recurrent behavioral tendency.
For traders interested in structured approaches to reviewing decision quality across multiple sessions, Stop Bad Trading Habits: Review Decisions With Real Data covers a broader weekly review framework. Traders looking at a specific behavioral pattern may find Revenge Trading: How to Spot Patterns in a Journal more directly applicable.
FAQs
What counts as a repeated pattern, and not just a one-off trade?
A single trade, or even two similar trades, doesn't constitute a pattern. A pattern should recur at least three times, ideally more, across different sessions or market conditions. If a trader makes an impulsive entry once and then reverts to their usual process, that's an isolated event. If the impulsive entry recurs consistently after certain triggers (e.g., after wins, or during specific times), it qualifies as a pattern worth investigating.
Can I identify patterns from a spreadsheet, or do I need special software?
Patterns can be identified from any consistent record, a notebook, spreadsheet, or digital journal, provided the data is complete and regularly reviewed. The comparison depends on recording habits and preferred workflow. A spreadsheet requires manual data entry and organization but puts the data under the trader's direct control. Digital tools may automate some data capture and offer visualization features, but only if the trader maintains consistent use and accurate logging. Neither approach guarantees better pattern detection; consistency matters more than the tool.
If a pattern appears but my account is still profitable, should I try to change it?
A repeated pattern reflects a behavioral tendency in the decision-making process, separate from whether that process currently produces profit or loss. A trader might be profitable despite a poor process (good luck), or unprofitable despite a sound process (bad luck). Evaluating decision quality separately from profit or loss helps. If the pattern represents a deviation from the trader's strategy, such as inconsistent position sizing or entries without analysis, addressing it typically reduces unnecessary risk, even if recent outcomes were favorable. Changing the pattern is optional; understanding it is valuable.
What if I find multiple patterns at once?
If a journal review reveals several recurring behavioral patterns, prioritize the one that appears most frequently or has the clearest impact on plan adherence. Starting with one pattern makes it easier to test hypotheses and measure whether an adjustment works. Once that pattern is addressed, the trader can move to the next. Trying to change multiple patterns simultaneously often results in inconsistent execution and muddied results.
How far back should I review to find patterns?
Review a sufficient body of trades to allow patterns to emerge, typically 20 to 50 trades, depending on trading frequency. A trader who makes 5 trades per day could review a week; a trader who makes 5 trades per week should review two to three months. The goal is enough data to distinguish genuine recurrence from random variation, while keeping the review session manageable enough to conduct thoroughly and honestly.
Why is my journal showing correlation but not causation?
A journal captures what happened (trades and outcomes) and what the trader felt or decided (emotions, reasoning, plan adherence). It doesn't capture the underlying mechanisms of market behavior or cognition. If a trader felt anxious before three trades and all three lost, the journal shows correlation: anxiety and loss appeared together. The journal doesn't explain whether anxiety caused poor decision-making, whether poor decisions caused the losses, or whether the losses were due to market conditions that would've produced losses regardless of the trader's emotional state. Proving causation requires controlled experimentation or analysis across many traders, not a single trader's journal.