
Did You Exit Too Early? Review MFE Without Hindsight
- Trading Process Coach

You closed the trade at breakeven. Two bars later, price rallied 3R. Your stomach drops.
The answer depends entirely on whether you followed your plan at the moment you closed the position, not on what happened next. Maximum Favourable Excursion (MFE) measures the best price your trade reached while you were still holding it, distinct from movement after your exit. When compared across similar trades over time, MFE reveals patterns in your exit behaviour. This article shows how to calculate it, evaluate your decisions against your original criteria, and use repeated data to improve your process.
Quick answer: Did I exit too early?
Exit quality is determined by whether the exit aligned with your documented trading plan and the information available at the moment you closed the position.
MFE measures the highest price reached during your holding period (for a long trade) or the lowest price (for a short trade). The gap between MFE and your realised profit isn't automatically recoverable profit or proof of a poor decision. A single trade's outcome can't confirm whether you exited too early; patterns across comparable trades provide more reliable information for review.
Calculating MFE: step-by-step example
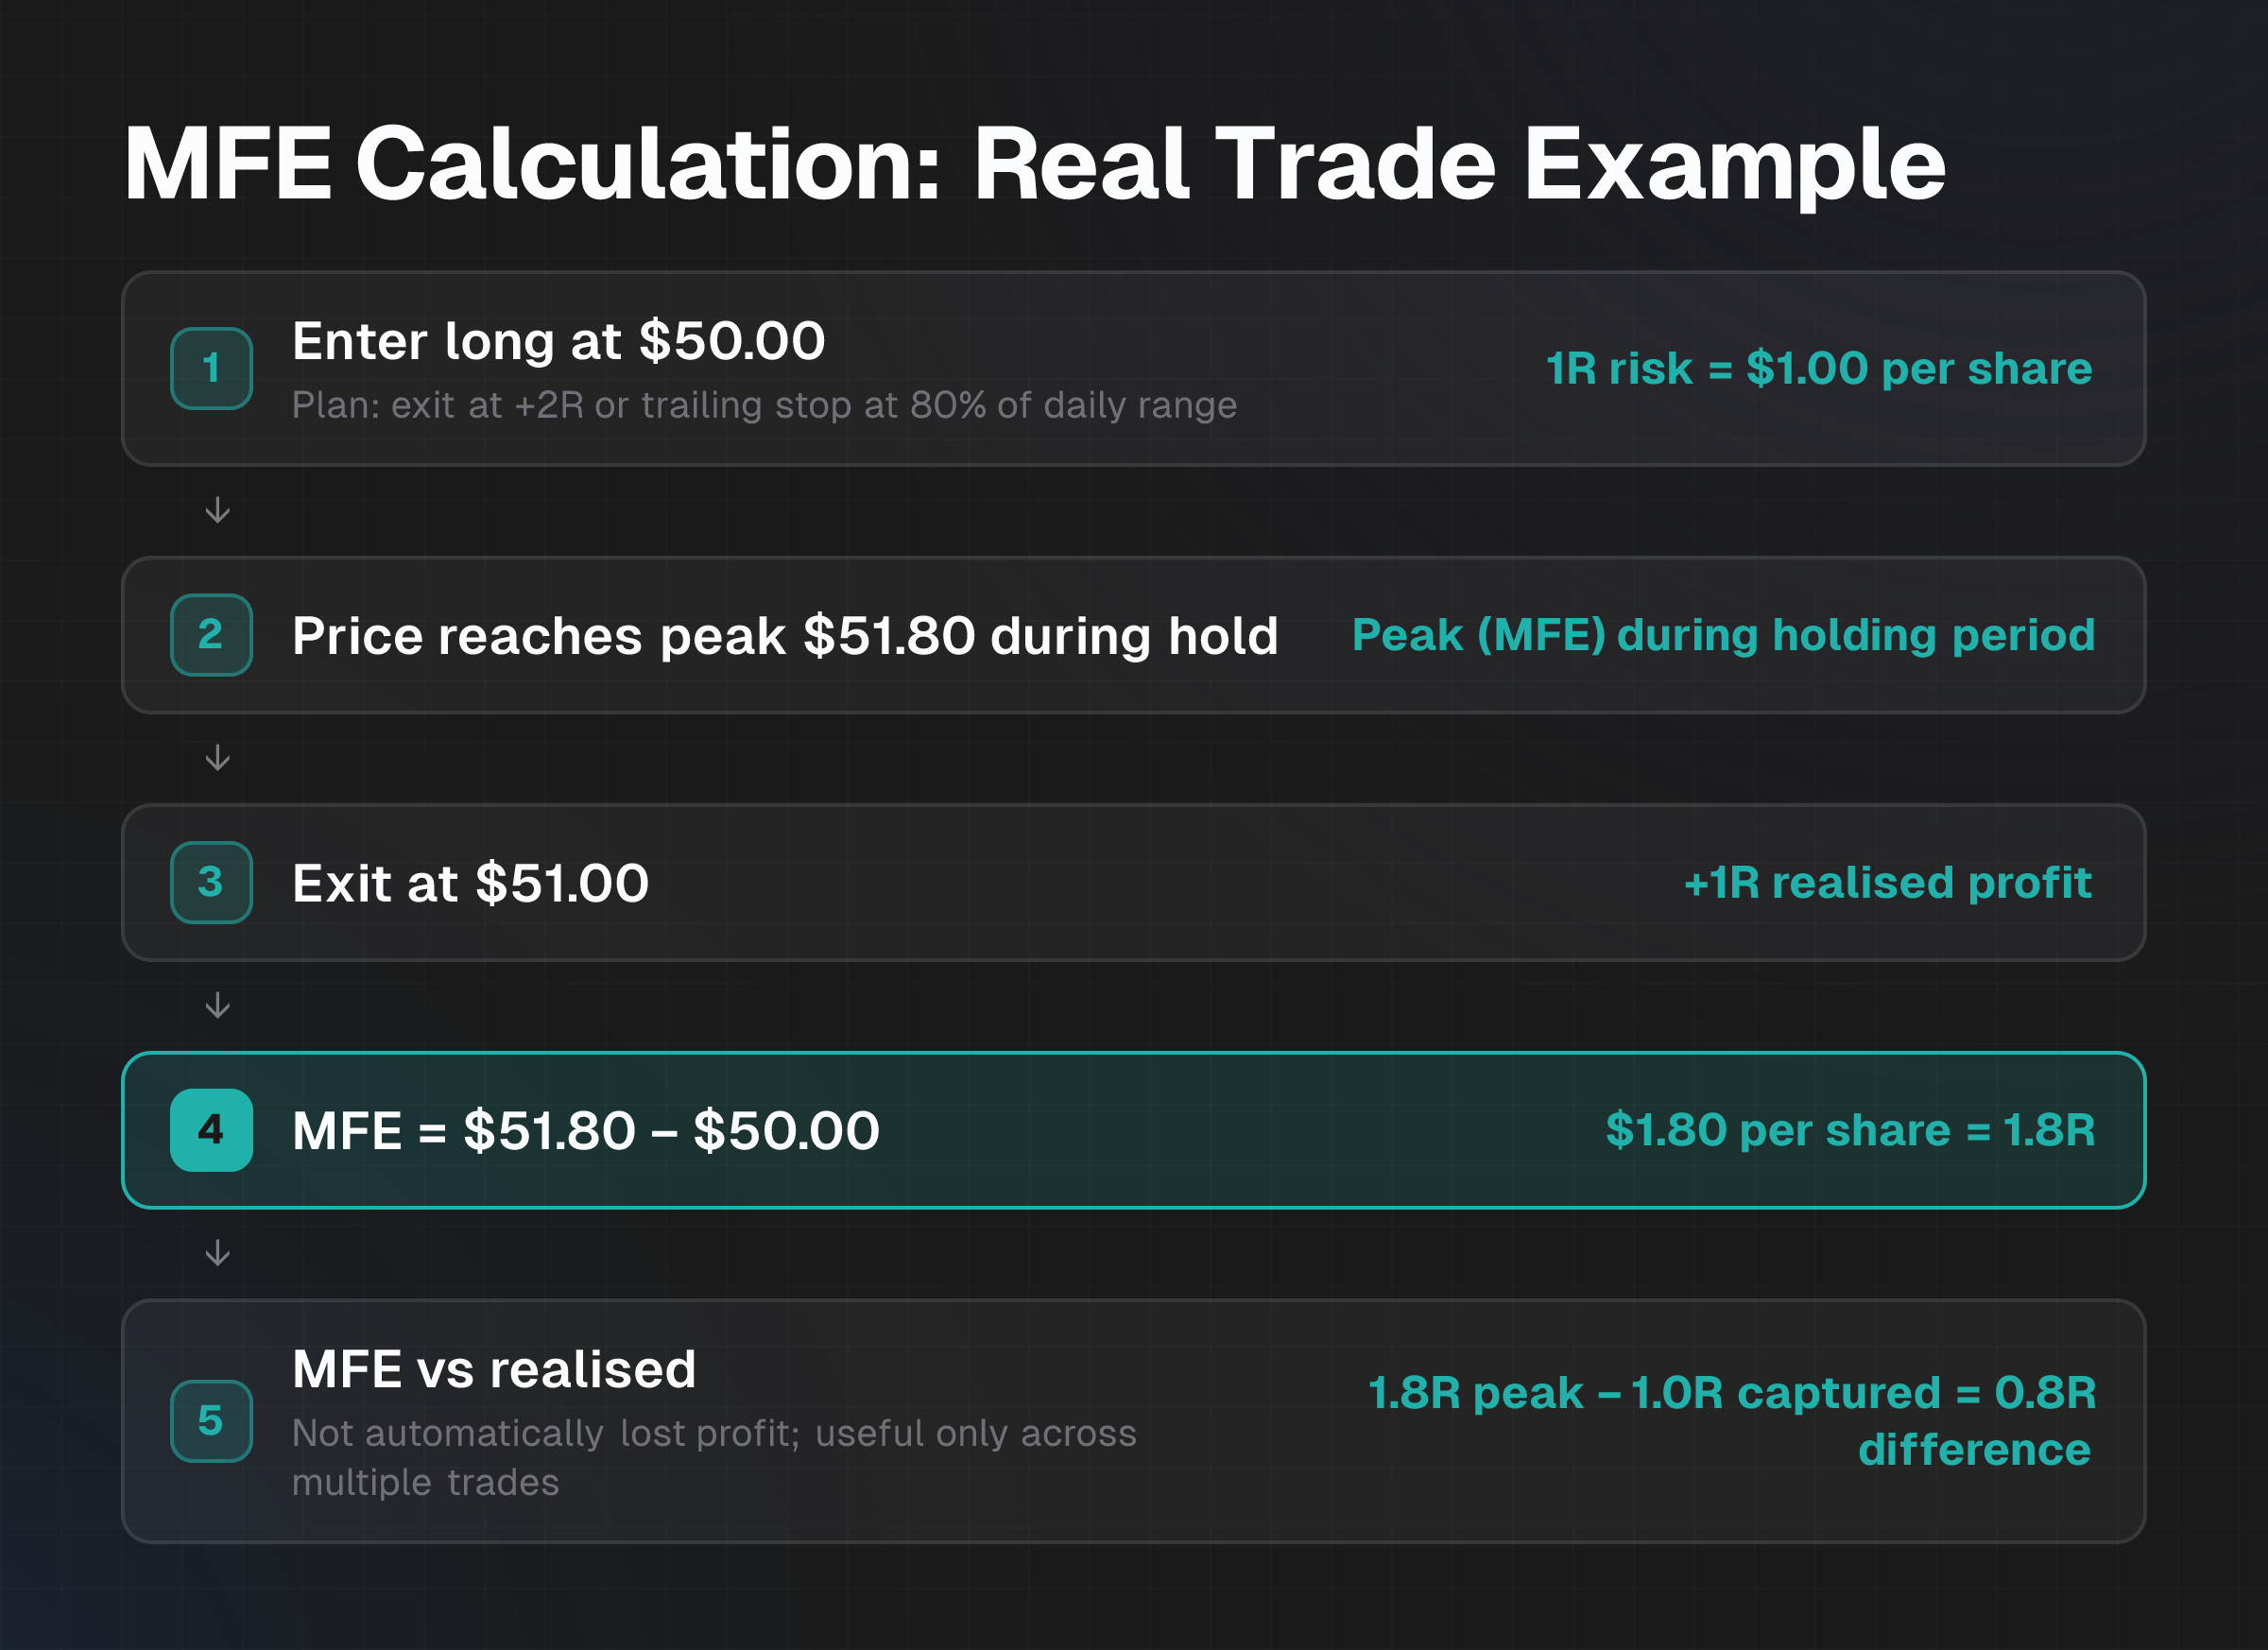
You enter long at $50.00 with a 1R risk of $1.00 per share. Your plan: exit at +2R ($52.00) or trailing stop at 80% of the daily range. During the hold, price reaches $51.80 (your peak), then retraces. You exit at $51.00, capturing +1R realised profit.
MFE calculation:
Peak price during hold ($51.80) − Entry price ($50.00) = $1.80 per share, or 1.8R.
MFE vs realised profit:
1.8R peak − 1.0R captured = 0.8R difference.
That 0.8R isn't necessarily lost profit. Capturing the exact peak requires perfect timing. The comparison becomes useful only when you review multiple trades with similar setups and spot recurring differences, say, consistently capturing 50% of MFE across ten comparable trades. That pattern suggests an exit behaviour worth investigating, not that any single trade was mishandled.
What the data can't explain
MFE shows what price was reached, not why you exited or whether capturing more would have been realistic. Volatility, spread, execution speed, and trade management difficulty make perfect timing improbable. A high MFE doesn't prove you left money on the table.
MFE analysis can't diagnose emotional drivers, predict future performance, or determine whether a single trade's outcome validates your strategy. Hindsight naturally suggests price could have moved further; MFE is data about what did happen during your trade, not proof that you should have acted differently.
Reviewing repeated occurrences
Examine comparable trades: similar setup, instrument, direction, and market conditions over a session or week. Compare realised profit to MFE for each. Look for recurring differences.
Are winning trades capturing only 30% of their MFE consistently? Are losing trades holding through large MFE before reversing past your stop? These patterns across multiple trades, not single outcomes, suggest where your exit process may benefit from adjustment. Include both winning and losing trades; a pattern matters only when it repeats. How to Find Trading Patterns in Your Journal provides a framework for spotting these sequences.
Questions to ask after the trade
Was there a documented exit plan for this trade before or at entry? Did the exit price match your planned profit target, trailing stop, or risk-management level?
If the exit deviated from the plan, was there a specific market event or valid reason recorded at the time? What market information was available at your exit moment?
Does the difference between MFE and realised profit match a pattern across comparable trades, or is it an outlier? Did you follow your process, regardless of the outcome? Trading Plan Adherence: How to Measure It in Your Journal shows how to measure alignment with documented criteria.
Practical review worksheet
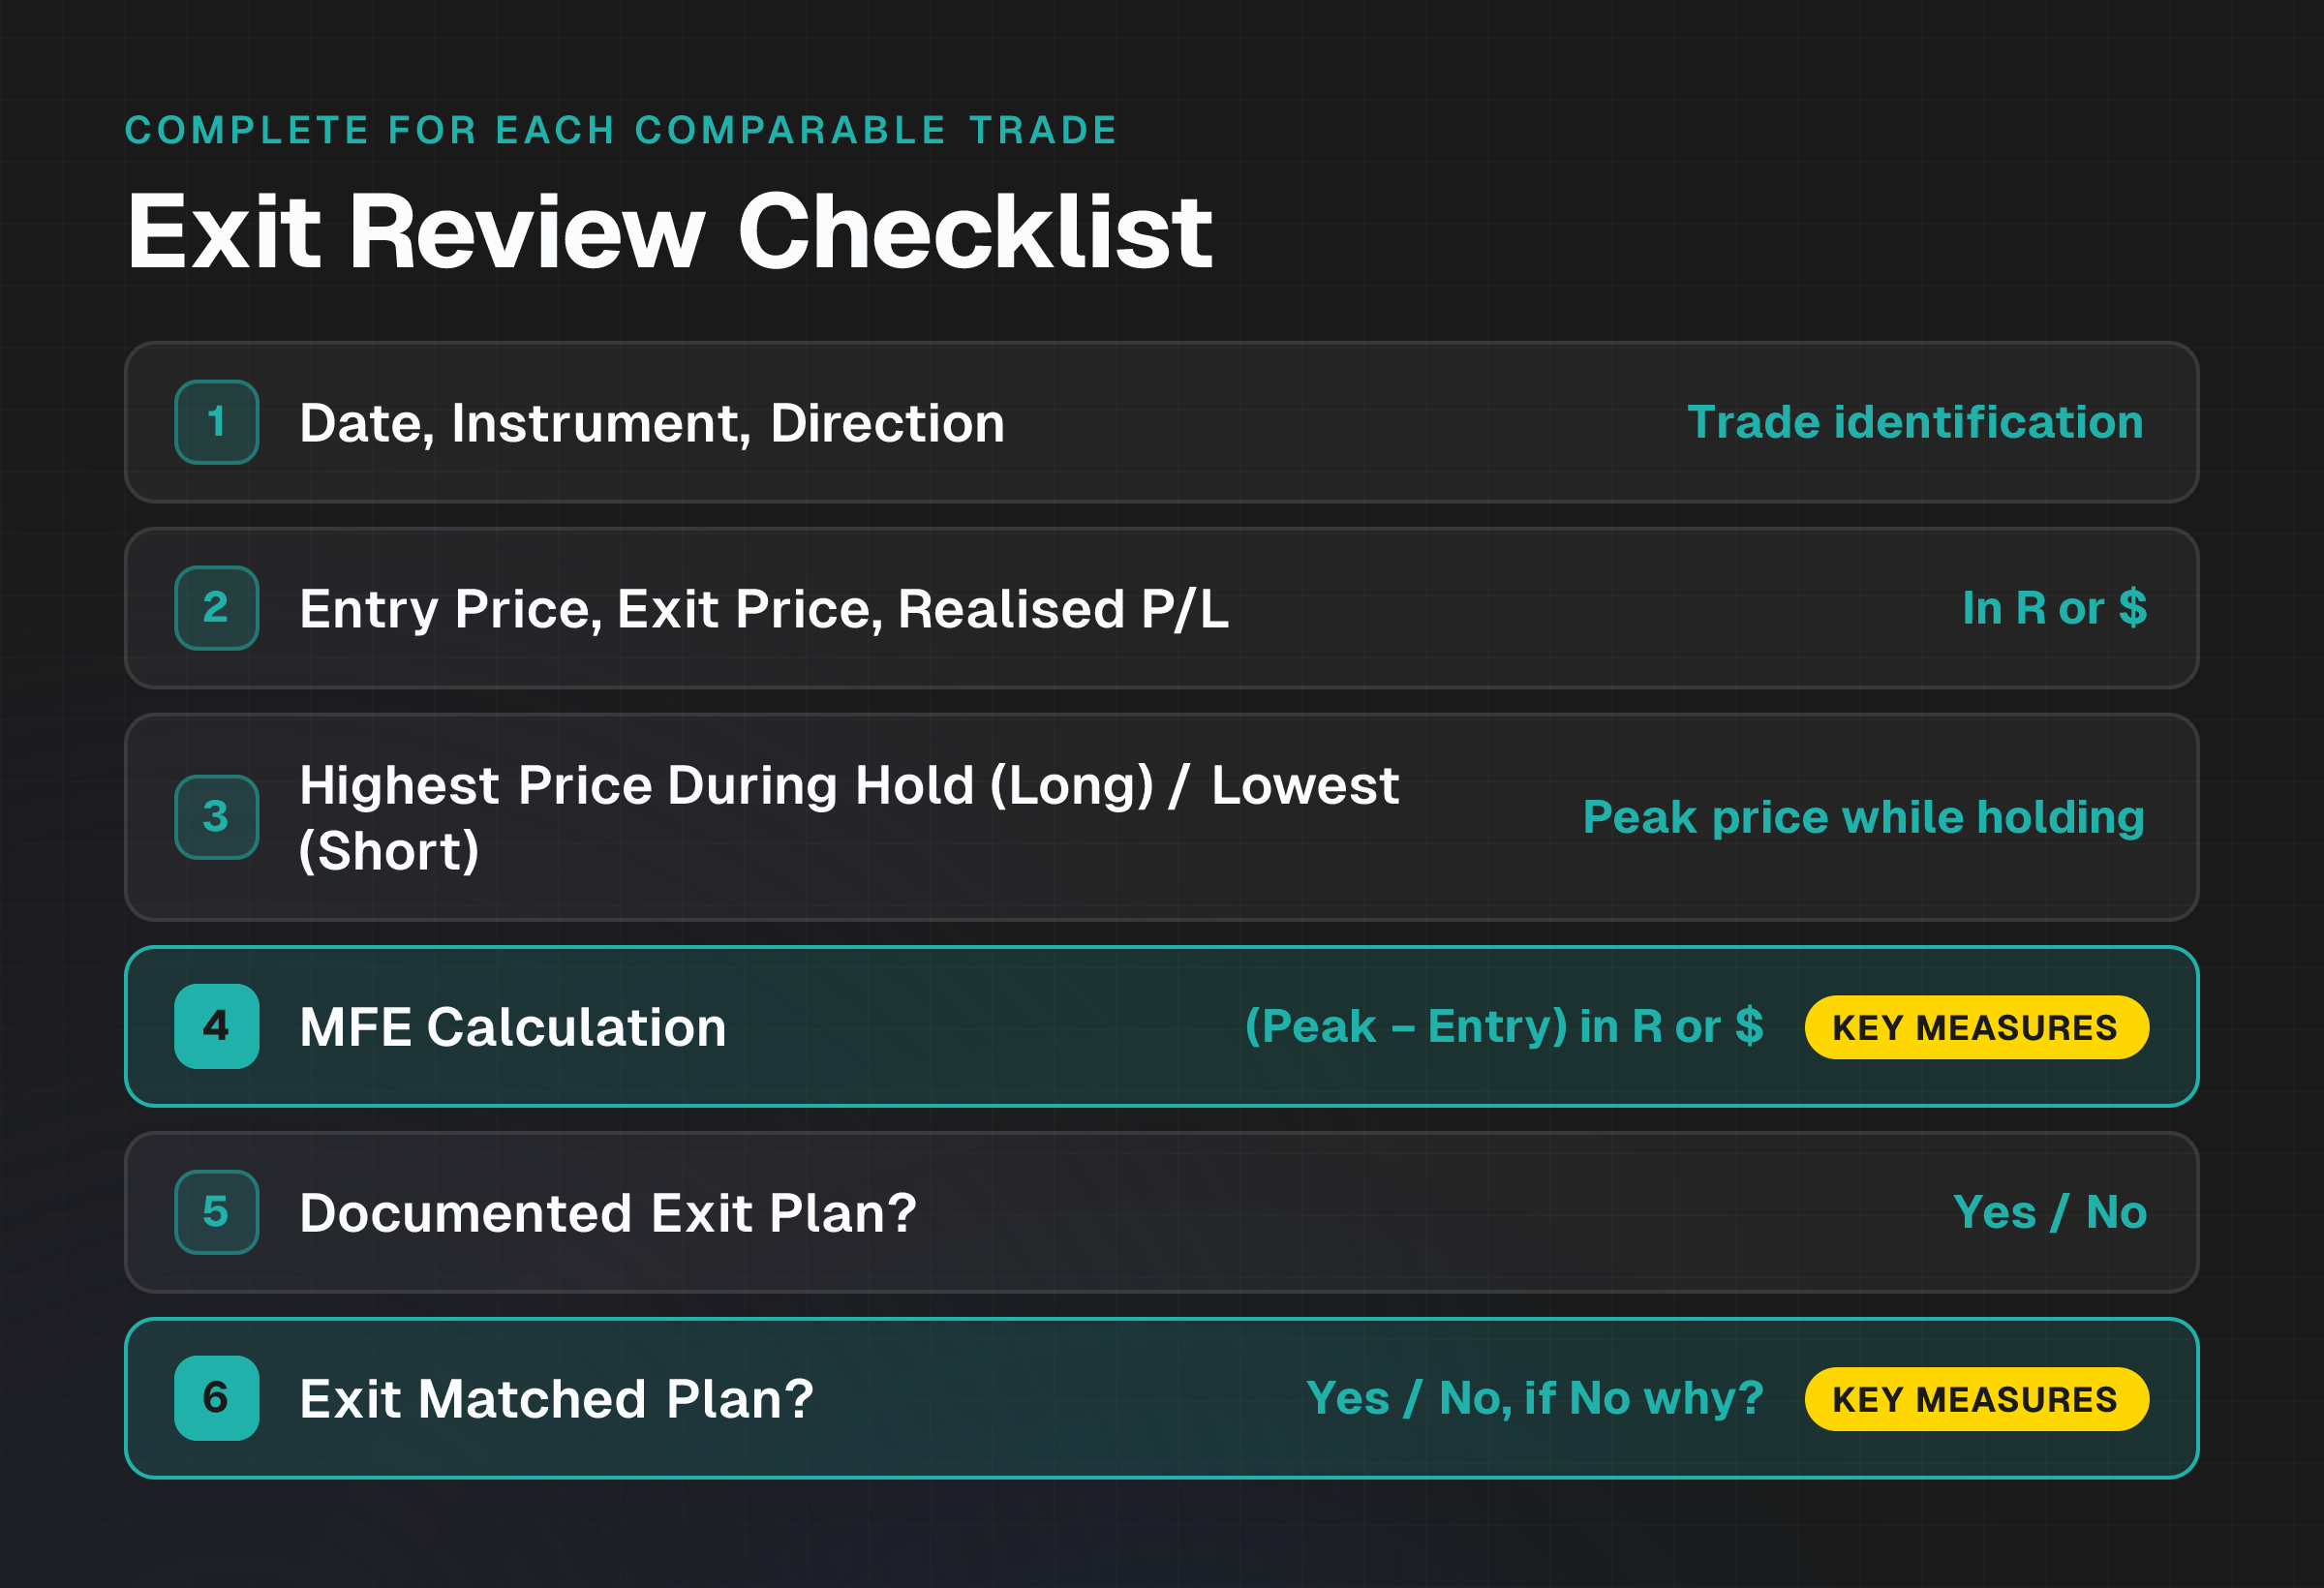
Exit Review Checklist
| Field | Entry |
|---|---|
| Date | |
| Instrument | |
| Direction | Long / Short |
| Entry Price | |
| Exit Price | |
| Realised P/L | (in R or $) |
| Highest Price During Hold (Long) / Lowest Price During Hold (Short) | |
| MFE Calculation | (High/Low Price − Entry Price) = |
| Documented Exit Plan? | Yes / No |
| Exit Matched Plan? | Yes / No, If No, why? |
| Market Event or Reason for Deviation? | |
| Emotional State at Exit | (e.g., confident, anxious, relieved) |
| Exit Adhered to Process? | Yes / No |
| MFE vs Realised P/L Difference | (in R or $) |
| Pattern Across Comparable Trades? | |
| One Practical Focus for Next Session |
Limitations
MFE analysis is only as reliable as the records supporting it. Missing or inconsistently recorded exit prices, peak prices during the hold, or planned exit levels will distort the comparison. Comparing trades with vastly different setups or timeframes can produce misleading patterns.
One trade showing a large MFE-to-profit gap is noise; a pattern requires multiple occurrences. MFE doesn't replace a tested strategy, position sizing rules, or stop-loss discipline. Stop Bad Trading Habits: Review Decisions With Real Data outlines broader decision-review methods.
Next step
Choose one recent comparable trade: same setup, similar market conditions, same instrument. Calculate its MFE, compare it to your realised profit, and record whether the exit matched your plan.
Repeat this for 3-5 similar trades over your next trading week. After reviewing the cluster, identify one concrete adjustment, tighter profit targets, earlier trailing stops, clearer plan documentation, or better record-keeping. Test that adjustment for one week and measure the result. This focused approach yields more reliable feedback than reviewing individual trades in isolation.