
How to Check an AI Trade Review: A Practical Checklist
- HybridTrader Editorial
Active traders face a recurring dilemma: how to assess AI-generated insights about their behaviour without clear criteria for reliability. An AI trading journal can spot correlations across hundreds of trades, log decisions systematically, and calculate risk from recorded history. But when the AI flags "you exit winning trades early on Wednesdays," that's an observation, not an explanation. Correlation isn't causation. Before you adjust your process based on a detected pattern, you need a structured way to verify the underlying data, consider alternative explanations, and test whether a change actually helps. This guide provides a practical framework to separate genuine behavioural patterns from statistical noise and to distinguish verified data from speculation in AI trading platforms.
Manual review of hundreds of trades is time-consuming and prone to selective memory. Traders recall emotionally charged trades more vividly than routine ones. Confirmation bias leads you to see patterns that fit preexisting beliefs while overlooking contradictory evidence. AI can process large datasets faster and more objectively. Speed and scale create a new challenge, though: how do you know whether an AI observation reflects genuine trader behaviour or coincidental clustering in the data?
An AI system can't understand intent. It can't explain why a pattern occurred, only that it exists in the recorded trades. A pattern that appears significant over 200 trades may dissolve when external market conditions, strategy changes, or recording inconsistencies are accounted for. Without a verification process, you risk making unnecessary changes based on association rather than causation, or ignoring real behavioural patterns that warrant attention.
Check the trades and notes behind the observation
Start by accessing the specific trades the AI identified. Verify entries and exits against your broker statements. Review the journal notes you wrote for each trade at the time.
Look for data accuracy first. Do timestamps, prices, and position sizes match your broker records? Are there data-entry errors or missing details? An AI trading journal records what traders log and what brokers report, not trader intent, market psychology, or causation.
Then examine personal context. What was your mindset? What was your stated rationale? Did you follow your plan, or deviate intentionally? These details appear only in the notes you recorded at the time, not in execution data.
Finally, assess market conditions. What was volatility like? Were there news events, liquidity concerns, or sector-specific moves? Did these differ between the flagged trades and other periods?
The quality of AI observation depends entirely on the consistency and completeness of recorded data. Sparse journal entries, missing broker data, or incomplete position records produce flawed or misleading patterns. HybridTrader's AI system identifies recurring patterns in trade entry, exit, risk, and timing. The AI Psychologist feature (Pro-only) detects behavioural observations from journaled trade data, early exits, over-leveraging, or clustering of losses around specific market conditions or times. It flags correlations between recorded decisions and outcomes across multiple trades, presenting these observations as starting points for review, not as diagnoses or prescriptive instructions.
Test alternative explanations
Before concluding you've found a behavioural habit, investigate whether external factors better explain the pattern.
Could market context account for it? If Tuesdays historically see lower volatility in your traded instruments, early exits might be rational, not habitual. Did your trading approach change during the period the AI analysed? A shift from scalping to swing trading naturally alters exit timing.
Are the trades clustered because of a specific market event or asset-class change you introduced, rather than recurring habit? Data artefacts matter.
Check for confirmation bias deliberately. Are you seeking evidence that supports an initial belief? Look for counter-evidence, trades on Tuesdays where you held longer, or non-Tuesday trades where you exited early.
The AI analysis depends on three layers of data: trade execution records (entry price, exit price, position size, instrument, date, and time) synced from broker feeds or manual entry; trader journal notes (subjective context recorded at or shortly after each trade, rationale, market conditions observed, emotional state, strategy applied, and any deviations from the trading plan); and outcome data (profit/loss, holding time, and exit reason). When any layer is incomplete, the pattern loses reliability.
AI pattern recognition produces observations: repeated associations in recorded data. It does not produce causal explanations, predictions of future trades, or endorsements of strategy changes. When the AI reports "you exit early on Tuesdays," it means that pattern appeared in past data. It doesn't mean the pattern will continue, that your early exits harmed performance, that you must change your process, or that the pattern is the only factor in your outcomes. The output is most useful as a prompt for manual investigation.
Worked example: Is this an early-exit habit?
AI observation: "You closed 7 of 9 winning trades in the first 30 minutes after entry on Tuesday mornings between March and May."
Step 1, Check the trades and notes: You pull up all nine trades. Eight match your broker statements exactly; one shows a timestamp error in your journal (corrected). Your notes for six trades mention "took profit quickly, nervous about reversal." For two trades, you wrote "tight stop hit by volatility spike." One note simply says "standard exit."
Step 2, Test alternative explanations: You check economic calendars. Five of the nine Tuesdays had scheduled data releases at 8:30 AM. You traded between 8:45 and 9:15 on those days. Volatility spiked after the releases, then dropped sharply. On the four Tuesdays without major releases, you exited early on only two trades.
Step 3, Formulate a qualified conclusion: The pattern isn't purely behavioural. Data-release volatility on five Tuesdays likely justified tighter exits. But on the four quieter Tuesdays, you still exited two winning trades early without a clear market reason. Your notes mention nervousness, not market conditions, for those two trades.
Hypothesis: You may exit winning trades prematurely on quieter Tuesday mornings due to fear of giving back profits, separate from rational responses to data-release volatility.
What to monitor next: Track exit time, exit reason, and post-exit price action on the next 20 trades on Tuesday mornings without scheduled data releases. Note in your journal when you feel nervous about holding a winner. After 20 trades, compare: Did you hold longer? Did profitability improve, worsen, or stay flat?
This example shows the difference between a correlation ("early exits on Tuesdays") and a qualified conclusion based on verified data and alternative explanations. The trader hasn't assumed causation. They've isolated one possible behavioural factor, controlled for market context, and defined a specific test.
Your AI trade-review checklist
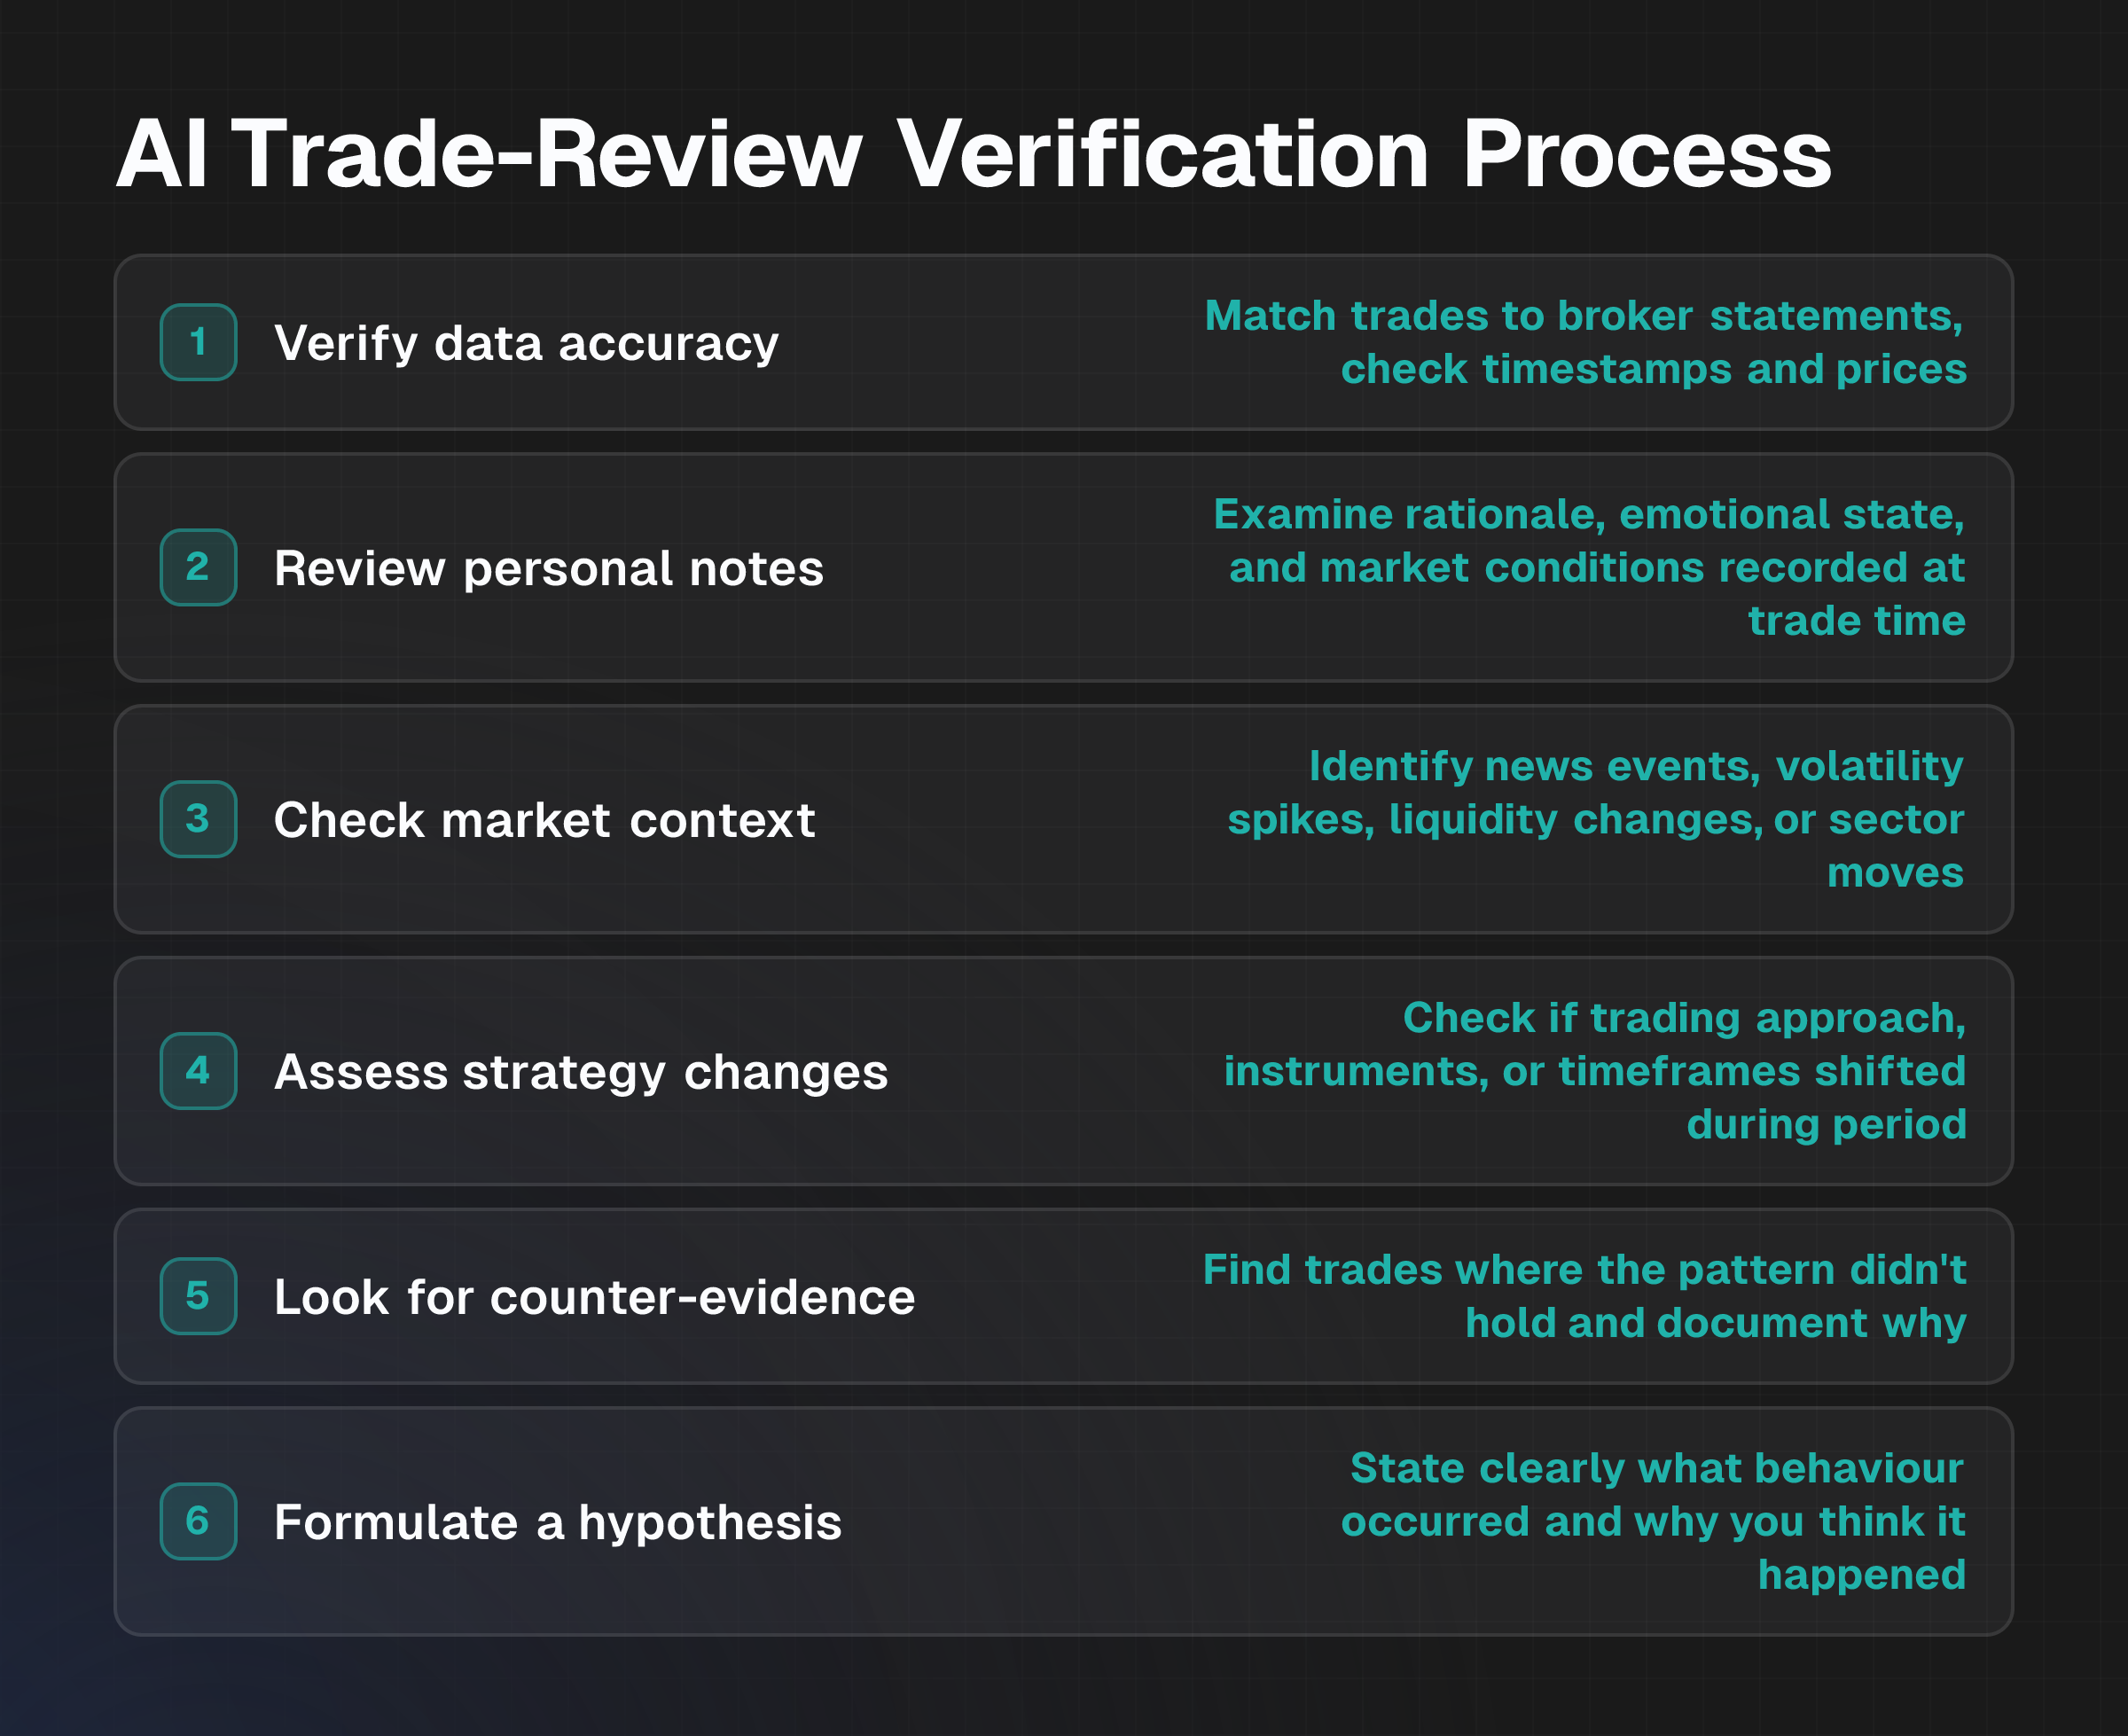
Copy this into your journal template:
□ Verify data accuracy: Do the flagged trades match broker statements? Are timestamps, prices, and position sizes correct?
□ Review personal notes: What rationale, emotional state, and market conditions did you record at the time?
□ Check market context: Were there news events, volatility spikes, liquidity changes, or sector moves that explain the pattern?
□ Assess strategy changes: Did your trading approach, instruments, or timeframes shift during the period?
□ Look for counter-evidence: Find trades where the pattern didn't hold. Why didn't it?
□ Formulate a hypothesis: State clearly what behaviour you think occurred and why.
□ Define metrics: What will you measure to test your hypothesis?
□ Set a test period: Commit to a defined number of trades or calendar period.
□ Record test context: Note in your journal when you're testing a new rule or process.
□ Re-evaluate after the test: Did the pattern frequency change? Did performance improve, worsen, or stay flat?
This workflow is most useful for traders with a consistent journaling practice who want structured evidence before changing their process, traders willing to test hypotheses over a defined period, and traders seeking to avoid premature process changes based on every AI observation. It's less suitable for traders who record few journal notes, trade infrequently, or expect AI to generate new strategies or predict performance.
AI pattern detection has clear boundaries. It can't establish causation. It can't predict future outcomes under different market regimes. It can't infer intent or emotion; only your journal notes and review reveal that. It can't account for survivorship or selection bias if you record losses less consistently than wins. It can't test statistical significance on its own. And it can't replace backtesting or live testing, observing a past pattern doesn't tell you whether changing your process will improve future results. Only a defined test period and subsequent trade data can do that.
How to Find Trading Patterns in Your Journal walks through the mechanics of pattern review in greater depth. HybridTrader's auto-synced journal functionality centralises trade data from broker connections and manual entry; traders retain full control over what data is recorded, which notes are added, and which analyses they run. For data handling, encryption, and retention specifics, review the platform's terms and privacy policy directly on the HybridTrader website.
Start with one AI observation that seems most relevant. Use the four-step workflow: check the trades and notes, test alternative explanations, formulate a qualified hypothesis with clear metrics, then commit to a test period and re-evaluate. Document each step in your journal, not only the trades and metrics, but your reasoning for ruling out or accepting each alternative explanation. This creates a repeatable process that separates genuine patterns from coincidence and converts AI observations into actionable insights grounded in your own verified data.